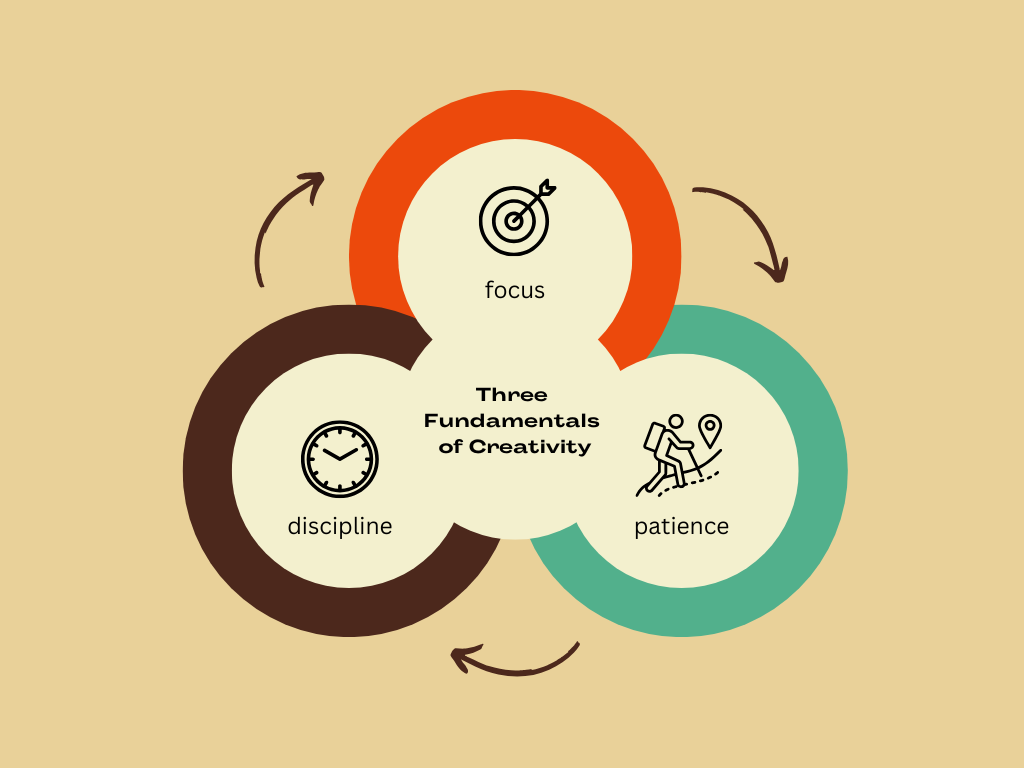
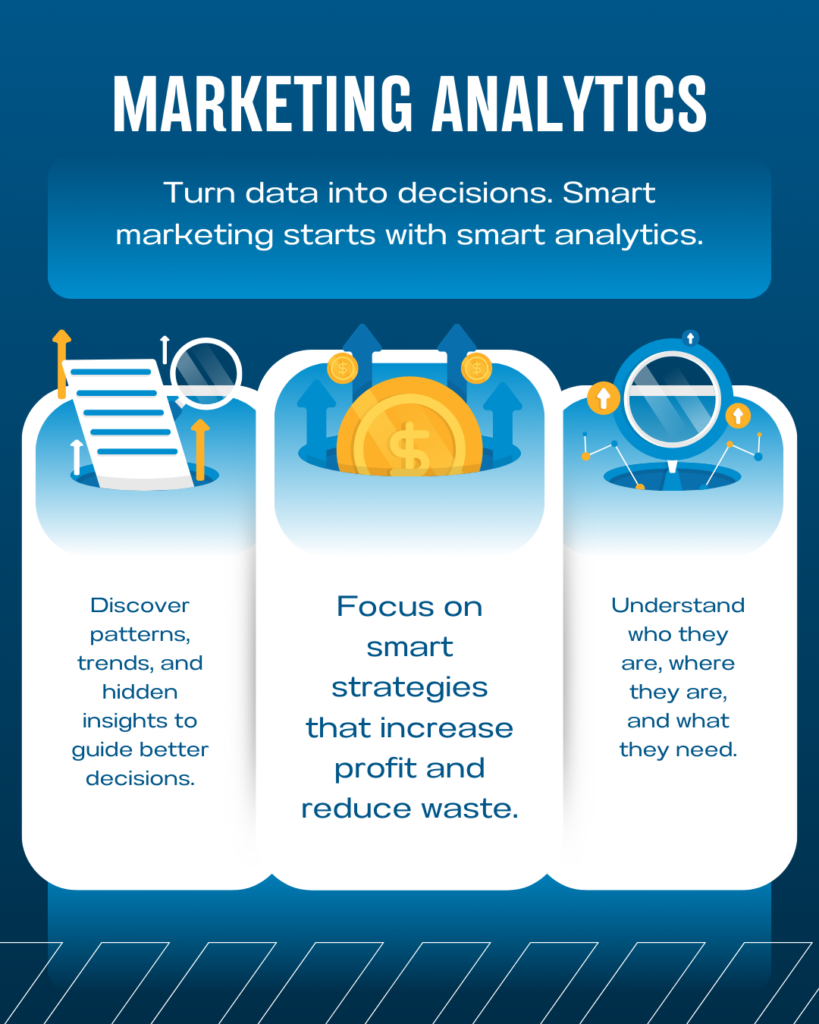
An infographic set is a visual story where data speaks through design rather than numbers alone. In this project, I focused on explaining trends and information using Canva, transforming complex data into visuals that feel clear, engaging, and meaningful. Every infographic begins with a purpose: to introduce the audience to a topic and gently guide them into understanding it. Instead of overwhelming viewers with dense statistics, the design invites them in, making the information approachable and visually appealing from the first glance.
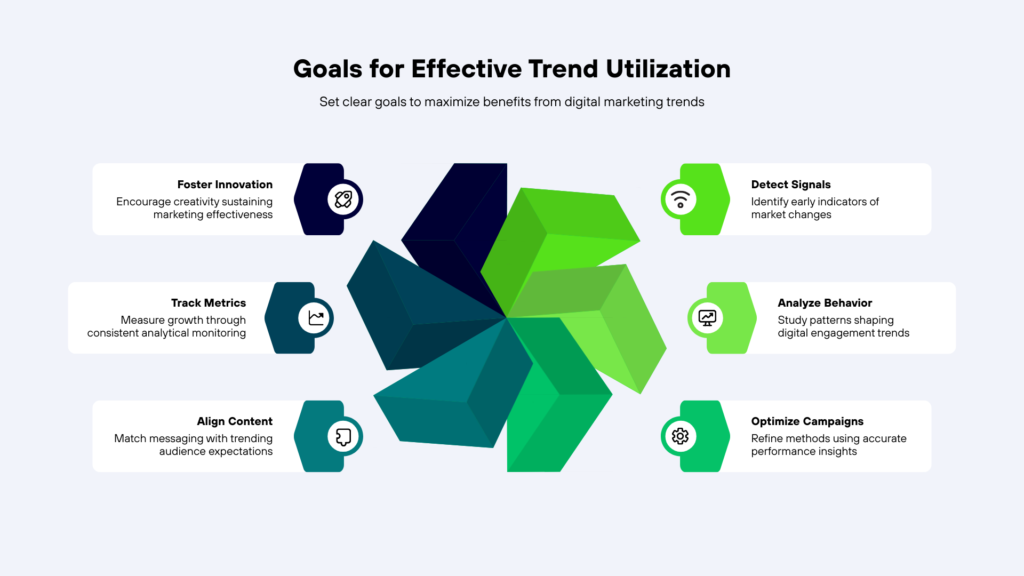
As the story unfolds, each infographic within the set acts like a chapter, building on the previous one to create a smooth narrative flow. Charts, icons, illustrations, and typography work together to highlight patterns, comparisons, and changes within the data. Canva’s tools made it possible to maintain consistency across the entire set, ensuring that colors, layouts, and visual elements remain cohesive. This consistency helps the viewer stay focused on the message, allowing the trends to emerge naturally through design rather than explanation alone.
What makes this infographic set effective is its balance between creativity and clarity. Every visual element is intentional, supporting the data instead of distracting from it. Short descriptions and visual cues guide the audience’s eye, helping them understand not only what is happening in the data, but why it matters. The storytelling approach ensures that each insight feels connected, turning raw information into a memorable experience.
This project demonstrates how Canva can be used as a powerful storytelling platform for data visualization. By combining thoughtful design choices with clear data presentation, the infographic set communicates trends in a way that is both informative and visually engaging. It reflects my ability to translate information into compelling visual narratives, making data easier to understand, more engaging to explore, and impactful for a digital audience.
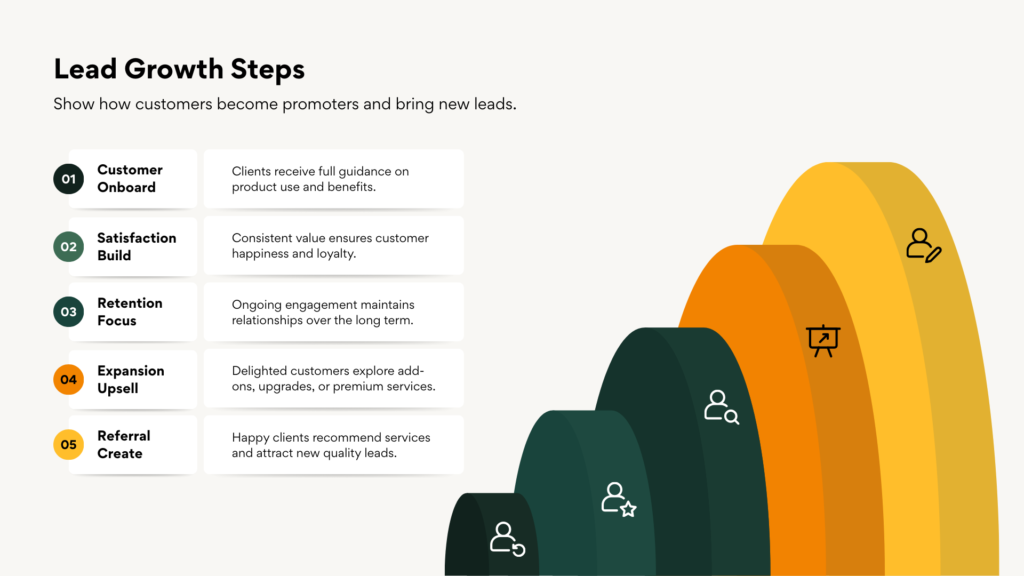
An infographic set is a visual narrative that transforms data into a story people can easily understand and connect with. In this project, I explored how trends and information can be presented in a structured yet creative way using Canva. Instead of treating data as static numbers, the goal was to give it a voice through thoughtful design. Each infographic is designed to spark curiosity, inviting the viewer to explore insights gradually rather than absorbing everything at once. The story begins with context, setting the stage for the trends and data that follow.
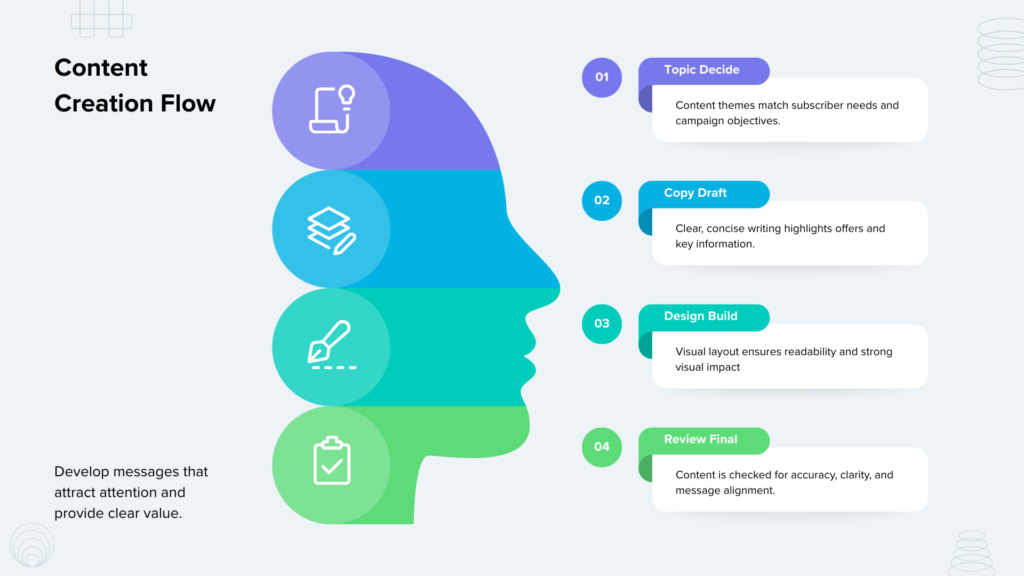
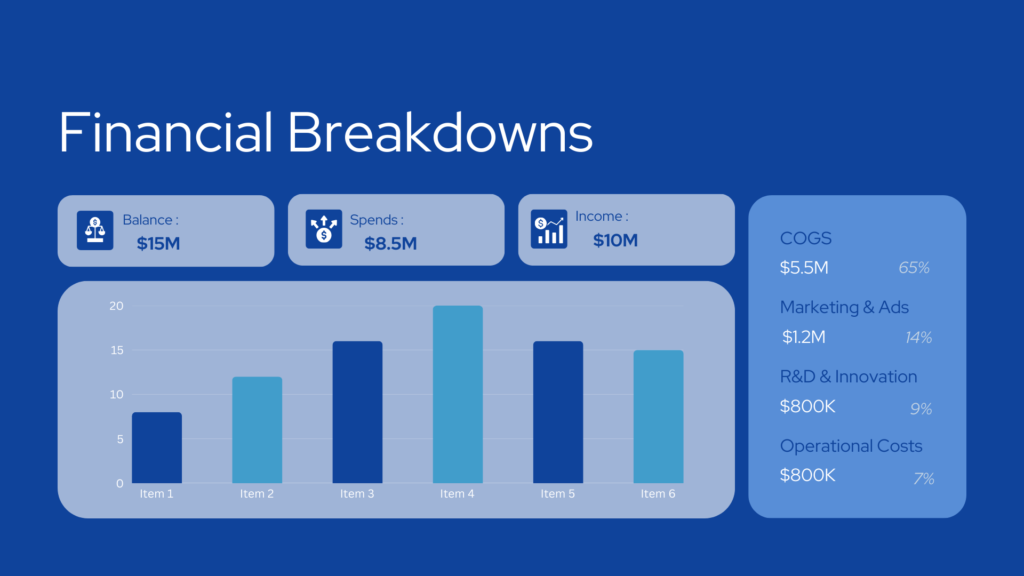
As the narrative progresses, every infographic within the set plays a specific role, much like chapters in a book. Some visuals introduce key trends, while others dive deeper into comparisons, growth patterns, or changes over time. Canva’s charts, icons, typography, and layout tools made it possible to present information clearly while maintaining a cohesive visual identity. Consistent colors, spacing, and design elements help guide the viewer’s eye, ensuring the data feels connected rather than fragmented.
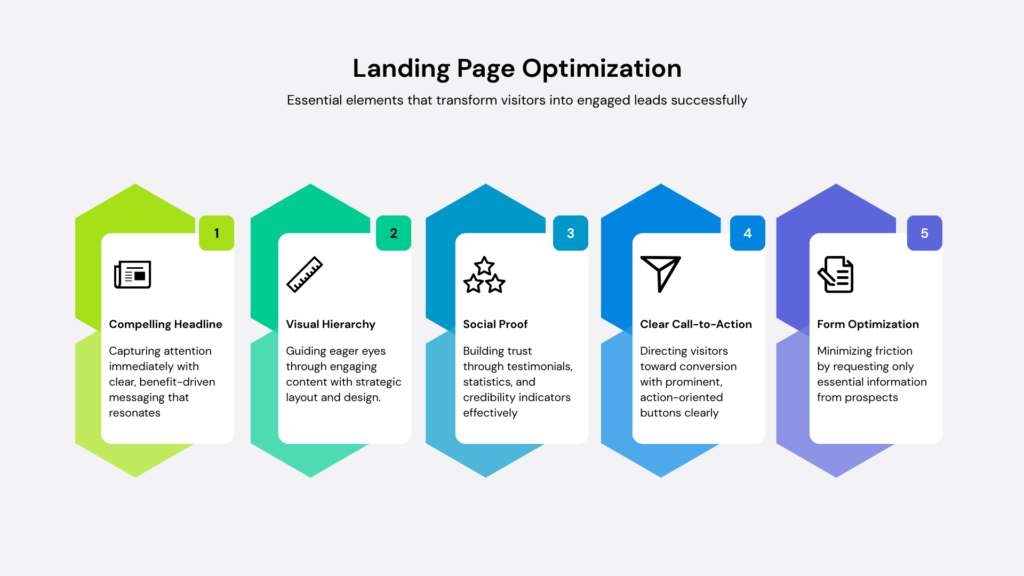
Storytelling through data requires balance, and this infographic set focuses on clarity without sacrificing creativity. Visual hierarchy, concise text, and intentional design choices ensure that each insight is easy to grasp. Instead of overwhelming the audience, the information unfolds naturally, allowing viewers to pause, reflect, and understand the meaning behind the trends. This approach helps transform complex data into visuals that feel approachable, engaging, and memorable.
This project highlights how Canva can be used as a powerful tool for data storytelling. By combining design principles with clear data visualization, the infographic set communicates trends in a way that is both informative and visually compelling. It reflects my ability to translate information into meaningful visual stories, demonstrating how thoughtful design can turn data into an experience rather than just a presentation.
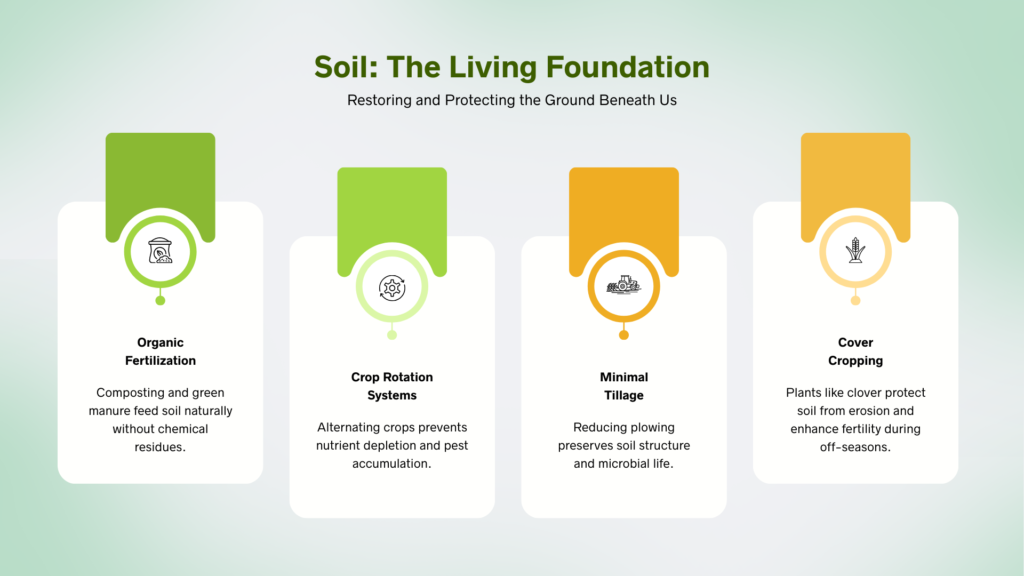
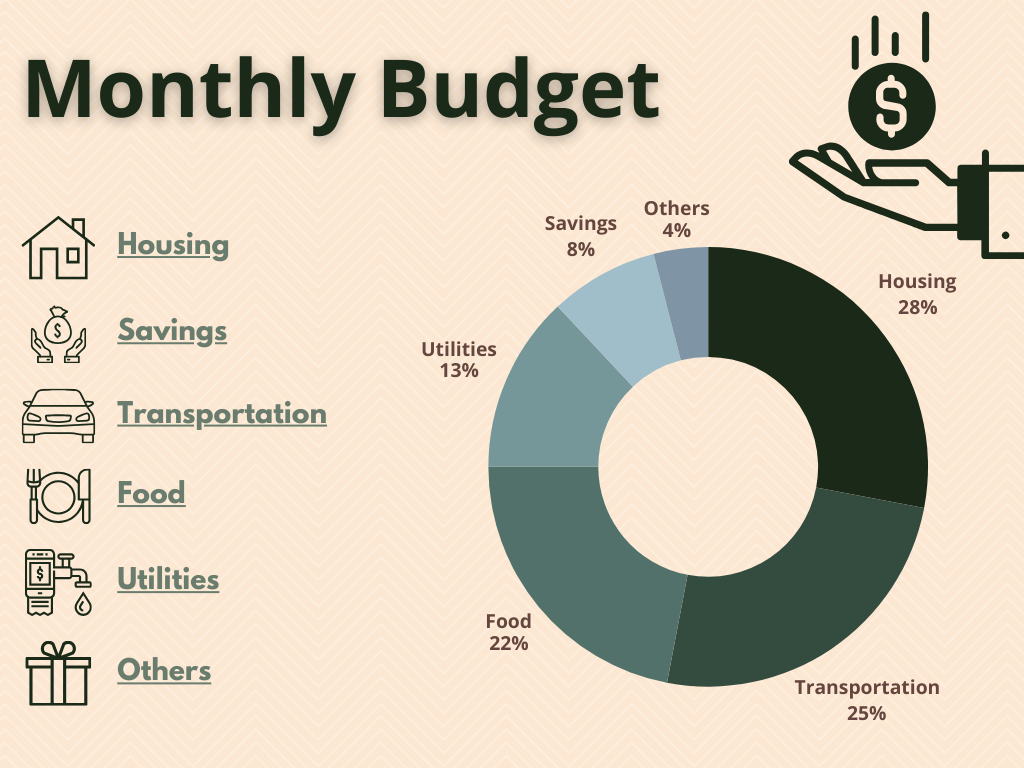
An infographic set is a visual story where data is transformed into an experience rather than a collection of statistics. For this project, the focus was on explaining trends and information through design using Canva, allowing complex ideas to become clear, engaging, and accessible. The journey begins with understanding the purpose behind the data—what story it wants to tell and how it should be felt by the viewer. Instead of presenting information all at once, the design introduces the topic gradually, drawing the audience into the narrative and encouraging exploration.

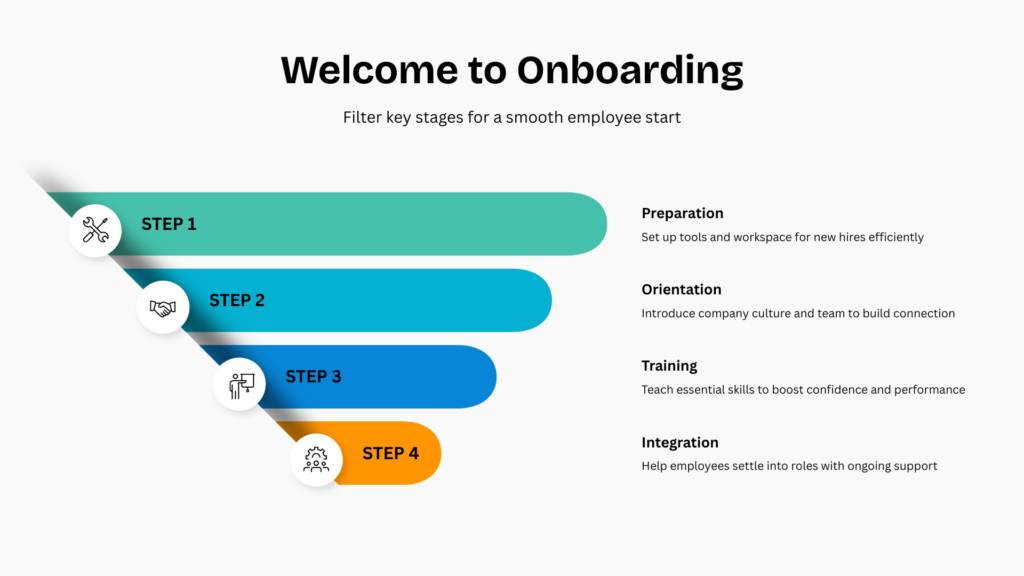
Each infographic within the set acts as a chapter in the story, carefully arranged to build understanding step by step. Some visuals highlight key trends, while others reveal patterns, comparisons, or changes over time. Using Canva’s layout, chart, and design tools, the infographics maintain a consistent visual language through color, typography, spacing, and iconography. This consistency helps create a seamless flow, allowing viewers to focus on insights without distraction. The data is not just shown; it is guided, framed, and emphasized through thoughtful design choices.
What makes this infographic set impactful is the balance between clarity and creativity. Every element is intentionally placed to support the message and enhance comprehension. Short explanations, visual cues, and structured layouts help the viewer quickly understand what the data represents and why it matters. The storytelling approach ensures the information feels human and relatable, turning abstract numbers into meaningful insights that resonate with a wider audience.
This project demonstrates how Canva can be used as a powerful tool for data storytelling and visual communication. By combining design principles with data visualization, the infographic set effectively explains trends while maintaining a clean, modern, and professional aesthetic. It reflects my ability to translate information into compelling visual narratives, making data easier to understand, engaging to explore, and impactful for digital platforms.


Leave a Comment